Script Api
Hey everyone,
For the people who keep checking this blog: thanks a lot!
Recently I had quite a lot of deadlines, so as usual I didn’t write anything on my blog :) I did however work on quite some interesting things. Together with the guys on #x64dbg and some other people I worked on a script API for x64dbg. What this means is that (once this API is finished) people can write bindings for their favorite script language and publish it as a plugin!
Right now I have these implemented:
- Basic debugging stuff (run, step, stop, pause);
- Register setters/getters;
- Memory read/write;
- Pattern finding/writing;
- Module information;
- GUI selection setters/getters.
I plan on adding much more:
- PE information;
- Breakpoint management;
- Comment/Bookmark/Label/Function/Loop management (useful for analysis scripts);
- Settings;
- Event callbacks;
- Etc (contact me if you have requests).
Some work was done with AngelScript in the testplugin.
void myStepOut()
{
    duint cip = Register::GetCIP();
    Print("[SCRIPT] Started on CIP = 0x%p\n", cip);
    do
    {
        Debug::StepOver();
        cip = Register::GetCIP();
    }
    while(Memory::ReadByte(cip) != 0xC3);
    Print("[SCRIPT] Finished on CIP = 0x%p\n", cip);
}

void main()
{
    Print("[SCRIPT] Welcome to AngelScript!\n");
    myStepOut();
}
Another idea I had was to load script DLLS, so you can write scripts in your favorite programming language (basically any language that supports native exports). You would write a single export StartScript that then calls the script API directly. This would allow for many possibilities, including commercial unpacking scripts.
This summer I will try to work on x64dbg as much as I can, to at least complete the script API. I also plan on fixing performance problems and solving as many issues as I can. Contact me if you know C++ and like to work on x64dbg. All help is appreciated.
Till next time,
mrexodia
Function Analysis
Hey everyone!
Right now I am in the fourth and final term of this education year. It looks like I can go on studying computer science, since I passed all my exams as of now!
Introduction
In this post I will discuss a (fairly simple) algorithm I came up with half-drunk with the purpose of determining function boundaries in x86 assembly code. Right now, it is implemented in x64dbg and you can see how it works with a command called anal (short for analyze). It does not work on weird/obfuscated/Microsoft’s code, but it’s nice to have an idea where functions start and end without having to manually go through every function you are looking at.
Screenshot:
The requirements
Maybe you already noticed, but x64dbg does barely use the information provided in the PE Header of a debuggee for its operations. If your executable is malformed, but can be started by CreateProcess without problems x64dbg should be able to debug it.
The downside is that x64dbg has no idea if it is looking at code, an import table, a resource table or just random data. You would have to figure that out yourself. The upside is that anything that can be run by Windows can at least be started by x64dbg.
The algorithm has a very simple input: a block of memory. The output should be a list of function boundaries. It requires nothing to work, except the virtual base address of the memory block.
The idea
After talking with various people (including cyberbob who created ArkDasm) the thing a lot of people (including our ‘competition’ at HexRays) appear to do is some kind of recursive ‘tracing’ from a certain point (usually the entry point). Basically it simulates multiple possible execution paths from that point and constructs the function boundaries from data (such as call and ret instructions) it collected on the way.
Usually I like what the cool kids on the block do, but I saw some problems:
- Recursive algorithms require housekeeping. In this case you would need to make sure data is not analyzed more than once (in case of analyzing a recursive function).
- It is hard to estimate when the recursive algorithm would end. Maybe there is only one (very small) execution path and it ends immediately, or it keeps dragging on, evaluating thousands of possible paths.
- There is no known entry point.
Now computer scientists appear to like complexity analysis of an algorithm. Probably you cannot do better than linear anyway, so I decided that I wanted to algorithm to be done in linear time O(n).
The idea I had was very simple, but it requires two assumptions to work:
- Every call destination or immediate pointing inside the memory block given for analysis is assumed to be the start of a function;
- A function ends at or after the start of that function and cannot overlap with other functions.
The first assumption should be clear to you. The second assumption might not be, but it is actually very simple: when a function starts it has to end before another function starts. This means that this system will horribly break on optimized code that places chunks of code randomly scattered throughout the memory region. Microsoft’s kernel32.dll does this for example.
Now the actual idea is to do things in two steps:
- Find all function starts;
- Figure out where functions end.
Simple right?
Finding all function starts
Doing this is actually trivial with the given assumptions! Just find any immediate that points in the memory block currently being analyzed and then sort the results and remove duplicates (a function might be called from multiple places is why). The reason for the sorting that the end cannot be further away than the next function start.
Finding the end of a function #1
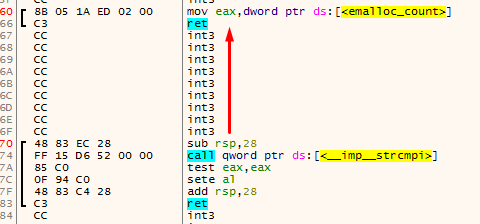
The thing that immediately comes to mind is just searching for the first ret instruction after the function start and call this the function end.
The problem with this approach is that there might be multiple exit points:
Finding the end of a function #2
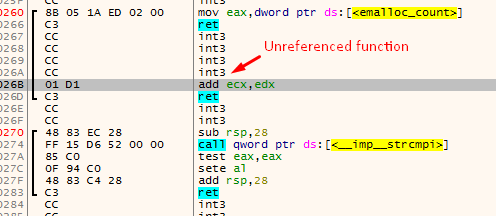
Another thing that comes in mind really quickly is just to scan backwards from a function start for the ret instruction. When found, this is the end of the previous function:
The main problem with this is that there could be unreferenced functions between the two functions that were found using the method for finding function starts. This could make really weird functions appear:
Finding the end of a function #3
The actual method I used to find the end of a function is a variation of #1. This algorithms has four cursors (the names are taken from the actual algorithm):
addris the current address being disassembled.addrwill always move forward disassembling every instruction on the way;endis the current function end (basically this is the lastretinstruction encountered byaddr);fardestis the farthest forward destination of ajxx. This will point to the farthest destination the function can go by using jumps;jumpbackis the address of the lastjmpinstruction that jumps before theendat that time.
For the understanding of the algorithm I visualized it using x64dbg. These are the colors used to indicate the various variables:
- addr
- end
- fardest
- jumpback
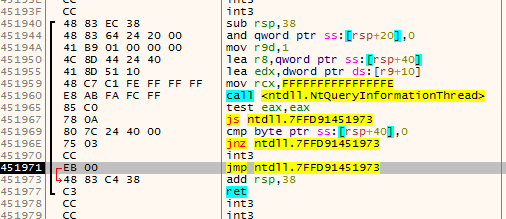
The first animation shows how fardest is used. When a ret instruction is encountered it is considered to be the function end if fardest has no value or points before the current ret instruction. When fardest points after the ret instruction, the algorithm will continue instead looking for another ret:
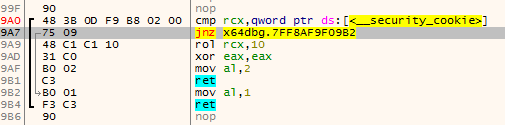
The second animation shows how the jumpback variable is used. Basically what could happen is that there is some kind of repeated structure before a function returns and that the compiler optimized this by jumping back to this structure from the end of the function (this could be done to save space for example). When the limit to where the algorithm can disassemble is reached the jumpback will be used as end of the function instead of end:
Final words
Alright, that was about it! I plan on improving this algorithm to support weird function structures done by some compilers, but the idea will stay the same (I think). I hope you enjoyed reading through this, I definitely enjoyed making it (even fixed some bugs on the way).
Greetings,
mrexodia
Progress
Hey guys,
After (again) almost a month of not writing I decided to write a little about various things I’m doing currently.
GleeBug
As some of you might have picked up I’m working on a replacement for TitanEngine. This replacement is going to be called GleeBug. Currently the project is in early stages, but with some help from nice people in my live stream we got single stepping with callbacks working very well!
GleeBug is going to have full support for child process debugging and it will be written in an object oriented style. (name) is working with me. You can find the repository here.
x64dbg
After I started a bachelor in computer science, other projects started degrading because of the lack of motivation and time I had. Recently I did a weekend of live streaming and it motivated me greatly! If I have some time between the assignments I have to do and playing GTA 5 (amazing game by the way) I will do another streaming session this weekend. Otherwise Monday (which is when I have to hand in the assignments).
A lot has happened to x64dbg since the last time I wrote, here is a quick summary for the people not following the commit logs:
- YARA rules matching was added;
- A new version was released;
x64_dbgis renamed tox64dbg;- We moved to GitHub;
- You can now donate with PayPal (or Bitcoin);
- Nukem did a great deal of refactoring with the result that x64dbg is now on VS2013. XP will stay supported, but backwards compatibility is still a WIP so the current snapshots will not run on XP (move on already guys);
- Various bugs were fixed (some fixed as a result of the refactoring), see the commit logs on the repository for more information.
Well, that’s about it! Thanks for reading and leave me a comment on my twitter or in the comment section.
mrexodia
Look Out!
Hey,
At the moment I feel like I should say I plan on posting something like every month from now on.
This is just a small post warning you guys for some very annoying behavior in DeviceIoControl. After a quick read of the documentation I did code like this:
static bool ControlDevice(HIDECOMMAND Command, HIDEINFO* HideInfo)
{
    HANDLE hDevice = GetDeviceHandle();
    if (hDevice == INVALID_HANDLE_VALUE)
	    return false;
    bool result = !!DeviceIoControl(hDevice, //hDevice
                                    Command, //dwIoControlCode
                                    HideInfo, //lpInBuffer
                                    sizeof(HIDEINFO), //nInBufferSize
                                    NULL, //lpOutBuffer
                                    0, //nOutBufferSize
                                    NULL, //lpBytesReturned
                                    NULL //lpOverlapped
                                   ); //
    CloseHandle(hDevice);
    return result;
}
Reading the documentation in a quick glance it looked like lpBytesReturned and lpOverlapped are optional (it says so in the function definition).
I tested the code on Windows 8.1 and everything worked fine, so I published the code. After a while however, my client told me there was a crash on Windows 7 near DeviceIoControl.
Reading the documentation again I stumbled across this sentence:
If lpOverlapped is NULL, lpBytesReturned cannot be NULL. Even when an operation returns no output data and lpOutBuffer is NULL, DeviceIoControl makes use of lpBytesReturned. After such an operation, the value of lpBytesReturned is meaningless.
Moral of the story: don’t assume optional actually means a parameter is optional in WinAPI documentation :)
Cya around,
mrexodia
Titanhide
Hello,
First of all I would like to thank to ~200 people (or bots) who still visit this blog! I didn’t post for a long time (again) because I was busy with a project for the university. Right now I had my exams, so I will have a little time to write a new blogpost.
Introduction
Some people might remember a project I started about a year ago. This project is called TitanHide and it was created to make kernel-mode debugger hiding possible on the x64 versions of Windows. At the time there was no kernel-mode hiding driver that worked on the x64 versions of Windows and that was also open-source. Trusting kernel drivers is really important (especially when they install hooks) because they can do anything with your system they like. TitanHide was meant to be easy to extend and it should work on both x32 and x64 systems.
Debug Detection
Software protection or malware usually doesn’t like being debugged. For this reason they usually insert various debugger checks. There are lots and lots of anti-debug tricks, see this paper for example. Some tricks like IsDebuggerPresent or NtGlobalFlag can be bypassed by changing the PEB in memory of the usermode process. Other detection methods cannot be evaded by a simple memory patch (NtClose for example). These detection methods require hooks. Hooks in user-mode (such as done by ScyllaHide) work in most cases, but more advanced debugger detection systems also detect user-mode hooks. In this case there is need for kernel-mode hooks, which is what TitanHide is using to evade debug detection methods. TitanHide does not patch the PEB or other things that can be done in user-mode, it’s focus lays purely in kernel-mode.
PatchGuard
In x32 times patching the kernel was officially unsupported by Microsoft, but there were no countermeasures built into the operating system against it. When Windows x64 came along, Microsoft added Kernel Patch Protection, also referred to as ‘PatchGuard’. PatchGuard prevents modification of critical kernel structures, such as the SSDT, which TitanHide uses to hook kernel functions. There are various methods of disabling PatchGuard, but TitanHide does not implement any of those. The main reason behind this is that TitanHide is purely meant to bypass debugger checks, not as a full-fledged rootkit library. If you want a quick way to disable PatchGuard, simply enable debug mode on your computer. This effectively stops PatchGuard from loading. If you want more information about PatchGuard I recommend reading this article. Everything that happens after this point is with PatchGuard disabled.
TitanHide
This post will mainly be about TitanHide installs it’s hooks. If you want more information about how the functions are modified to make it look like certain processes are not being debugged, you should read the code. I also recommend reading this paper about ScyllaHide. It can help while reading the TitanHide code (since the code itself is not greatly documented).
Many ideas in TitanHide come from different people around the internet, but the code in TitanHide is mostly written by myself. Code I used from the internet usually has a comment explaining where it came from. Some code was also written by cypherpunk. You can see which code specifically in the commit log.
SSDT Hooking
In short the System Service Dispatch Table (SSDT) is used by the operating system to determine which function to call after a transition from user to kernel-mode. The table contains kernel-mode function pointers and when a user-mode program wants to call such a function it provides an index to the function it wants to call in EAX. SSDT Hooking means replacing these kernel-mode function pointers with custom functions that either fully replace the existing function or modify the function behavior.
In x32 mode, replacing SSDT functions is quite straightforward (see this article for more information). Basically what happens is this:
SSDTStruct* SSDT = MmGetSystemRoutineAddress(L"KeServiceDescriptorTable");
SSDT->pServiceTable[FunctionIndex] = NewFunctionPointer;
On x32 versions of the operating system the SSDT structure is exported under the name KeServiceDescriptorTable by ntoskrnl.exe, which makes SSDT hooks really easy to implement.
On x64 versions of the operating system SSDT hooking becomes much harder. There are two reasons for this. The first reason is that the SSDT is no longer exported by ntoskrnl.exe, which means TitanHide must use different ways to find the SSDT. The other reason is that the SSDT no longer uses direct pointers, but offsets relative to the start of the SSDT. This means our hooks cannot be located too far from the ntoskrnl memory region.
Locating the SSDT on x64
After lots of searching around I found someone who discovered a semi-reliable way of locating the SSDT on x64 (I tested this method on Windows XP x64 - Windows 8.1 x64 with success). Read the original post here. For the purpose of this post I will line out the basics here, supported with some code.
An exported function called KeAddSystemServiceTable has a reference to the RVA of the SSDT. To find this RVA, TitanHide uses the following code:
/*
000000014050EA4A 48 C1 E0 05                shl rax, 5
000000014050EA4E 48 83 BC 18 80 3A 36 00 00 cmp qword ptr [rax+rbx+363A80h], 0 <- we are looking for this instruction
000000014050EA57 0F 85 B2 5C 0A 00          jnz loc_1405B470F
000000014050EA5D 48 8D 8B C0 3A 36 00       lea rcx, rva KeServiceDescriptorTableShadow[rbx]
000000014050EA64 48 03 C8                   add rcx, rax
000000014050EA67 48 83 39 00                cmp qword ptr [rcx], 0
*/
int rvaSSDT = 0;
for (unsigned int i = 0; i < function_size; i++)
{
    if (((*(unsigned int*)(function + i)) & 0x00FFFFF0) == 0xBC8340 && //4?83bc??
        !*(unsigned char*)(function + i + 8)) //???????? 00
    { //cmp qword ptr [r?+r?+????????h], 0
        rvaSSDT = *(int*)(function + i + 4);
        break;
    }
}
SSDT = (SSDTStruct*)((ULONG_PTR)GetKernelBase() + rvaSSDT);
Locating the SSDT on Windows 10 Technical Preview is a little trickier, but still possible:
/*
Windows 10 Technical Preview:
fffff800e21b30ec 757f             jne nt!KeAddSystemServiceTable+0x91 (fffff800e21b316d)
fffff800e21b30ee 48833deafee4ff00 cmp qword ptr [nt!KeServiceDescriptorTable+0x20 (fffff800e2002fe0)],0 <- we are looking for this instruction
fffff800e21b30f6 7575             jne nt!KeAddSystemServiceTable+0x91 (fffff800e21b316d)
fffff800e21b30f8 48833da0fee4ff00 cmp qword ptr [nt!KeServiceDescriptorTableShadow+0x20 (fffff800e2002fa0)],0
fffff800e21b3100 756b             jne nt!KeAddSystemServiceTable+0x91 (fffff800e21b316d)
*/
int rvaFound = -1;
int rvaSSDT = 0;
for (unsigned int i = 0; i < function_size; i++)
{
    if (((*(unsigned int*)(function + i)) & 0x00FFFFFF) == 0x3D8348 && //48833d
        !*(unsigned char*)(function + i + 7)) //???????? 00
    { //cmp qword ptr [?],0
        rvaFound = i;
        rvaSSDT = *(int*)(function + i + 3);
        break;
    }
}
//Calculate the actual address (rvaSSDT is a RIP-relative offset)
SSDT = (SSDTStruct*)((ULONG_PTR)KeASST + rvaFound + rvaSSDT + 8 - 0x20);
Hooking the SSDT on x64
In order to make sure the new function pointers ‘fit’ into the SSDT, I created a function called FindCaveAddress. That looks for compiler-generated padding, usually found around functions. It searched for a certain number of padding bytes and when found, a hook stub like this is inserted:
mov rax, NewFunctionPointer
push rax
ret
These stubs redirect the instruction pointer to our hooked function, making things really easy.
SSDT Function Index
Every function in the SSDT has an index, there are websites such as this one that list the all Nt* functions and their index, but hardcoding everything for every possible OS is tedious and error-prone work so I wrote a function to heuristically find an SSDT index for an exported ntdll.dll function. What is does is reading ntdll.dll from disk and then it parses the export table, searching for a function. If the function was found it looks for mov eax, XXXXXXXX, where XXXXXXXX will be the SSDT index. This is based on the fact that the ntdll.dll stubs look pretty much the same on every version of ntdll.dll until Windows 8.1:
0000000077EF0E10 | 4C 8B D1       | mov r10,rcx
0000000077EF0E13 | B8 40 00 00 00 | mov eax,40
0000000077EF0E18 | 0F 05          | syscall
0000000077EF0E1A | C3             | ret
If you are interested in the specifics of this code, take a look at ntdll.cpp.
This is how you hook a function exported by ntdll.dll using the current TitanHide codebase:
HOOK hNtQueryInformationProcess = SSDT::Hook("NtQueryInformationProcess", (void*)HookNtQueryInformationProcess);
That’s right, only one line of code to do any SSDT hook you want!
Conclusion
I hope you found this blogpost interesting, if you have any remarks, feel free to post them in the comments or send them to me.
Enjoy,
mrexodia