X64_dbg From Top To Bottom 1 The architecture of x64dbg...
Hello everyone,
Quite some time ago I started thinking about ways to engage more developers in x64dbg. The main problem new developers (in my view of things) have is that x64dbg is poorly documented. Code documentation is very important in software development but when I started with x64dbg the whole concept of software development was new to me, so I did not document my code. Recently I started documenting the code of x64dbg, but code documentation is very boring, so I decided to spice it up a little (for myself mainly) with a few blog posts.
Before reading
Before you start reading this post, I recommend you read up on Creating a Basic Debugger and you should know a little about threads. You should also know where to find x64dbg’s source code in case you want to see more of the code.
The debug loop
Technically the debug loop is part of TitanEngine, not of x64dbg. The design of the debug loop, however is very important for x64dbg in general, so I will explain it here anyway.
A basic debug loop looks like this:
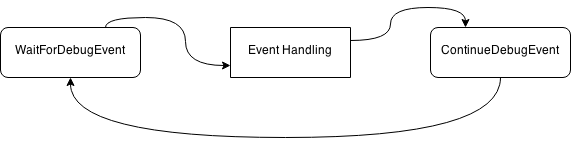
This is also how TitanEngine’s debug loop works. It handles events by calling so-called “Custom Handlers”, which you can register by calling the SetCustomHandler() function. In addition to calling custom handlers TitanEngine does a lot of housekeeping (like storing information about the threads, modules and breakpoints). It also handles certain exceptions like STATUS_SINGLE_STEP for stepping and STATUS_BREAKPOINT for software breakpoints.
The most important point of these custom handlers is the fact that they are part of the debug loop, which means the debug loop won’t continue until the custom handler returns.
Threading of the debug loop
Because the DebugLoop() function of TitanEngine does not return until debugging is finished (debuggee termination), it has to be run on a new thread, so we can continue using the GUI while debugging (which is the whole point of the GUI anyway).
Here is a little image for the overview:
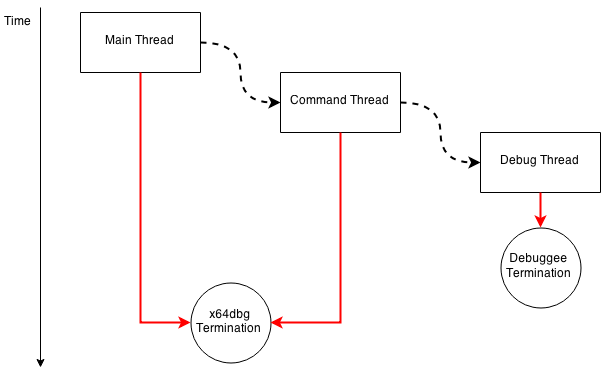
- A block represent a thread;
- A dashed arrow represents starting a new thread;
- A red arrow represents thread termination;
- A circle contains the termination condition.
The Main Thread starts the Command Thread. The Command Thread has an architecture similar to the debug loop; it waits for a command, calls a command handler and then starts waiting again.
When an InitDebug command is encountered (see help), information is obtained about the executable to debug and a Debug Thread is started. This Debug Thread contains the debug loop we discussed above.
Syncing the threads
The Debug Thread has to wait in custom handlers until the user tells it to continue (by pressing the run button in the GUI). This is done by a very simple locking system that has three main functions: lock(), unlock() and wait(). The wait() function simply waits while the lock is locked and it works across threads, so when the Debug Thread is waiting and the Command Thread calls unlock(), the Debug Thread will continue execution. You can find all this code here.
To provide thread-safe access to certain global variables (like breakpoint/comment/bookmark lists), x64dbg uses a class called CriticalSectionLocker. This class can be found in the same file as locking system above.
Conclusion
That’s all for now, I hope you enjoyed reading this and I will continue to cover various aspects of x64dbg, from the bigger picture, to small interesting details.
mrexodia
blog comments powered by Disqus